It’s Not Just Global Warming: How El Niño, a Hotter Planet and Human Choices Turn Hazards into Disasters
From flooded Bangkok to burning Indonesian peatlands, October 2026 has delivered disaster after disaster. Scientists say no single villain explains them all.
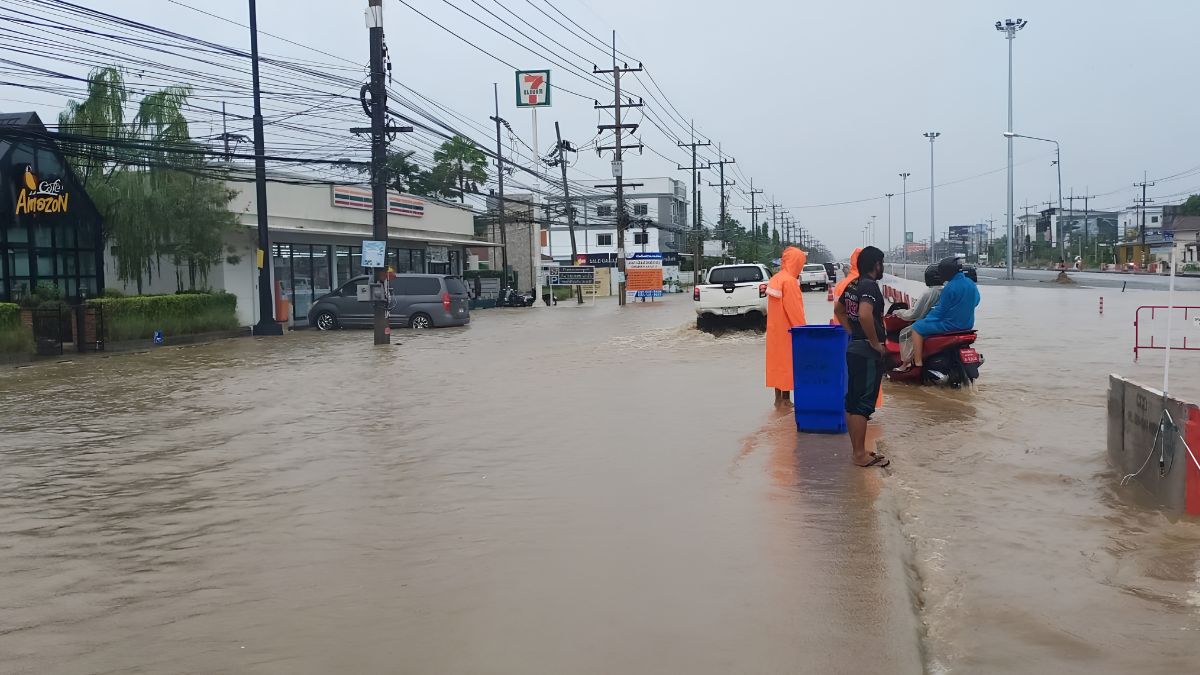
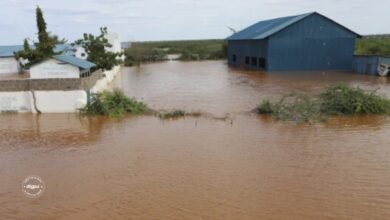
In the space of a few weeks, rivers have burst across 58 countries and territories, according to flood monitoring systems. Thailand’s floods have reached Bangkok and about 50 provinces, affecting an estimated 4.3 million people. Santiago in Chile has had its wettest October in 76 years. In Slovenia, 353 millimetres of rain fell in a single night. Meanwhile, Europe’s great rivers, the Rhine and the Danube among them, ran at record-low levels for September, and in Central America millions of people face crisis-level hunger after drought.
Floods and drought. Record heat and record rain. It is tempting to blame it all on one thing: global warming. Scientists say the truth is more layered, and more useful to understand.
The first culprit: a Pacific Ocean running hot
The biggest driver of this year’s global weather chaos is not human-made at all, at least not directly. It is El Niño, the natural cycle in which the surface of the eastern Pacific Ocean heats up and reshuffles weather patterns around the planet.
This year’s event is extraordinary. On 8 October, the US National Oceanic and Atmospheric Administration (NOAA) issued an El Niño Advisory, reporting sea-surface temperatures in parts of the eastern equatorial Pacific more than 4 °C above normal. The World Meteorological Organization (WMO) says the event is almost certain to last through February 2027, with forecasts pointing to what could be the strongest El Niño since modern records began.

There is a note of caution from Europe’s Copernicus climate service. It reports a record absolute temperature in the key Pacific monitoring region, but its director warns it is too early to call this the strongest El Niño ever, because an ocean-wide corrected measure has not yet passed earlier events. A record temperature, in other words, is not automatically a record El Niño.
What is not in doubt is the reach. El Niño tends to bring drought to parts of Southeast Asia, southern and eastern Africa and Central America, and heavy rain to other regions. It is a major reason for this season’s hunger warnings in Guatemala and Honduras, and it sets the stage for the drought-driven fires seen in Indonesia.
Seen from space: how NASA is watching it unfold
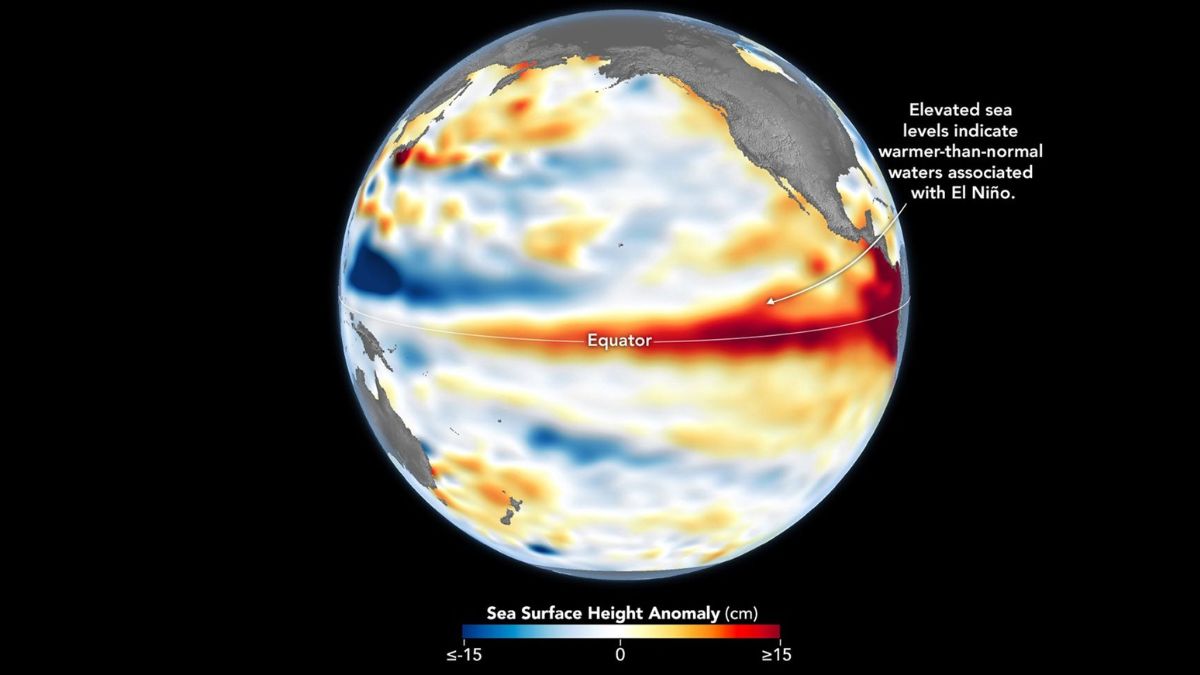
A NASA report published this week shows how this El Niño is being tracked from orbit, and it adds detail to the picture above. Satellites are picking up the event in three ways: the height of the sea, its temperature, and even its color.
A wave that started in January. The first clue appeared in satellite images in January 2026: a slow pulse of warm water, called a Kelvin wave, near Micronesia in the western Pacific. These waves stretch thousands of miles and carry heat from west to east across the ocean. As the warm water heats the air above it, the pressure changes weaken, or even reverse, the trade winds that normally blow from the Americas toward Asia. That lets even more warm water pile up in the east, and the cycle feeds itself. “Kelvin waves are like the heartbeat of El Niño,” said Josh Willis, a sea-level scientist at NASA’s Jet Propulsion Laboratory.
The sea itself is rising and falling. Warm water expands, so by early April, when the waves had reached the eastern Pacific, sea levels there were up by as much as 30 to 40 centimeters (1 to 1.3 feet) in places. The extra water could be seen moving toward South America and then up the coast toward California. Around Indonesia and northern Australia, levels were 15 to 20 centimeters (6 to 8 inches) lower than normal. NASA’s Sentinel-6 satellites measure this across the whole ocean every 10 days, a record that has run unbroken since 1993.
A warmer ocean, with a caveat on the numbers. NASA says sea-surface temperatures in the eastern Pacific are about 1.7 °C (3 °F) above the long-term average. That is lower than the figure of more than 4 °C that NOAA’s advisory cites for parts of the region. The two are not in conflict: one is a broad regional average and the other describes the hottest patches. Readers comparing numbers across agencies should check which measure is being used.
An ocean that is turning bluer. NASA’s PACE satellite, launched in 2024, is watching this year’s El Niño for the first time. It shows the normally greenish waters along the equatorial Pacific becoming bluer. The reason is a drop in phytoplankton, the microscopic plants at the base of the marine food web. With the trade winds weakened, less cold, nutrient-rich water rises from the depths, so there is less food for these plants. NASA notes that this decline can ripple through the food web and push other marine life to move to new feeding grounds. For fishing communities, that is one way a distant ocean pattern can reach the dinner table.
The second culprit: a planet that was already warmer
El Niño years have always been unusual. What has changed is the starting line.
September 2026 was the second-warmest September on record globally, about 1.63 °C above pre-industrial levels, according to Copernicus. The world’s oceans, which absorb most of the extra heat trapped by greenhouse gases, set a record: the global sea-surface temperature departure for September was the highest for any month on record, and the fourth consecutive monthly record. The contiguous United States had its hottest September ever.
Climate scientists generally describe global warming as an amplifier rather than a trigger. It does not conjure each storm out of nothing, but it loads the dice in several well-understood ways:
- Heavier rain. For every 1 °C of warming, the atmosphere can hold roughly 7 percent more moisture, which means downpours can release more water.
- Stronger storms. Warmer oceans provide more fuel for tropical cyclones, and help them intensify rapidly. This season saw an eastern Pacific hurricane, Polo, reach Category 5, among the most intense on record by pressure.
- Thirstier air. Higher temperatures dry out soil and vegetation faster, deepening droughts and making fires easier to start and harder to stop.
Put simply, El Niño shakes the weather, and a warmer world makes the shake more violent.
The third culprit: what we do to the land
Here is where many experts say the public conversation falls short. A storm is a hazard. It becomes a disaster only when it meets people, homes and infrastructure that cannot cope with it. And that part is largely a human story.
Cutting forests. Trees and their roots hold soil in place and soak up rainfall. Strip a hillside bare and the same storm sends water and soil rushing downhill, producing faster floods, landslides and mudflows. Deforestation also releases stored carbon, feeding the warming problem itself.
Paving over the ground. Concrete and asphalt do not absorb water. In fast-growing cities, rain that once soaked into soil now races into drains, and when drains are blocked or too small, streets become rivers. Researchers regularly point to unplanned urban growth when explaining flood damage in large cities.
Building where rivers belong. Homes and businesses on floodplains and along riverbanks are in the path of water long before the first drop falls. Poorly managed embankments, dams and drainage can make the damage worse.
Draining peatlands. Indonesia’s smoke crisis this season is a textbook example. Peat soils, when drained for agriculture, become highly flammable. Add an El Niño drought and the result is fires that burn for weeks. This year’s peat fires destroyed around 300 homes, displaced roughly 1,000 people and, according to the briefing data reviewed for this article, were linked to more than 280,000 acute respiratory cases, with haze drifting as far as Singapore.
Poverty and preparation. Perhaps the most important factor is the least visible one. Early-warning systems, evacuation plans, sturdy housing and emergency funding determine whether a heavy rainfall event is an inconvenience or a catastrophe. Panama offers a striking contrast: a magnitude 7.7 earthquake on 9 October, among the strongest of the year, damaged thousands of homes and hundreds of schools but killed only one person.
A case study in layers: Nepal
Nowhere do the layers pile up more clearly than in the Himalayas. Nepal’s Rasuwa district, along the Bhote Koshi river near the Chinese border, was struck by a devastating flood on 26 August. As of 1 October, relief agencies reported 1,453 deaths and 5,179 people missing, with 1.6 million affected and a recovery bill estimated at US$5.3 billion. The International Federation of Red Cross and Red Crescent Societies (IFRC) cautions that the death, missing and rescued counts overlap and still need to be reconciled, so the numbers may change.
The ingredients are all there: steep terrain, intense monsoon rain, a region where glaciers and mountain slopes are changing in a warming climate, and a corridor crowded with roads, hydropower works and settlements close to the river. Scientists studying such events often stress that it is rarely one factor but the combination that proves deadly. As always, how much each factor contributed in a specific case is a question for formal scientific analysis, and that work takes time.
What is not climate change
It would be a mistake to put every headline in the same box. Earthquakes, such as the one in Panama, and volcanic activity, such as at Taal, Kanlaon and Etna, are driven by forces deep inside the Earth and have nothing to do with the atmosphere. Disease outbreaks, such as the Ebola epidemic in the Democratic Republic of the Congo and cholera in parts of Central Africa, are health emergencies. Climate and weather can influence some diseases indirectly, but they do not cause these outbreaks. Mixing everything together, experts warn, weakens the credibility of the climate message itself.
How sure can we be?
Scientists are careful about one thing in particular: attributing a single event to climate change. The usual approach is to use computer models to compare the event with a world without human-caused warming, a method used by research groups such as World Weather Attribution. Those studies take time. Until they are done, careful language matters: “likely made worse by” is more honest than “caused by.”
The numbers in this fast-moving season also come with a warning label. Early casualty figures are routinely revised, and different agencies report different totals for the same event. Several tolls this year, including for storms in Mexico and Japan and for monsoon flooding in South Asia, remain contested. Readers should treat early figures as provisional.
What can be done
The good news embedded in the layered story is that layers can be tackled separately.
- Cut emissions, to slow the long-term rise in the baseline that every El Niño now builds upon.
- Protect and restore forests, wetlands and peatlands, which act as natural flood defences and fire breaks.
- Plan cities and settlements with water in mind, including drainage, green space and a stop to building in the paths of rivers.
- Invest in early warning and preparedness. Acting on a forecast before a disaster strikes saves lives. The IFRC’s early-action activation in Rwanda this month is one example of this approach.
The bottom line
This season’s disasters are not the work of one cause. A powerful natural Pacific cycle, a planet warmed by decades of emissions, and the choices people have made about land, cities and preparation have come together. Global warming is a real and growing part of the story, but it is not the whole story, and the parts we control, from the forests on the hillside to the drains in the street, are among the most powerful tools we have.