World Happiness Report 2021: India far behind Nepal, Bangladesh and Pakistan
The World Happiness Report 2021 shows how India is in no position to smile. It is inching closer to Taliban-ruled Afghanistan and is far behind all its neighbouring countries.
The 10th edition of the World Happiness Report was released on the 18th March 2022 by the United Nations Sustainable Development Solutions Network. The report contains the national happiness trends over the year 2019-2021. These trends are explored based on a deep analysis of various factors such as perceptions of corruption, social support, healthy life expectations, generosity, GDP per capita, freedom of choice among others.
The principal source of data for the World Happiness Report is the Gallup World Poll, which is a comprehensive and factual survey of the world. The Gallup World Poll takes between 1000 -2000 responses from each country.
The results of life evaluations are based on what is called the Cantril Ladder(1) or the Cantril Self-Anchoring Scale. The respondents are asked to evaluate and rate their life from 0 to 10, by creating the mental imagery of a ladder where 10 is the highest step on the ladder, equivalent to the best life of the respondent. In contrast to this, 0 represents the lowest step of the ladder, representing the worst life of the respondent.
Other notable steps in the Cantril Ladder are step 3 and step 7. Positioning oneself below step 3 represents suffering which means low incomes, lower education and social support, struggling for basic needs. Step 4-6 represents struggling, or in other terms neither thriving nor suffering. Similarly, the rating 7-10 is considered as thriving which necessarily means having higher incomes, higher education, good health and social support.


Further, positive emotions and negative emotions are also an indicator of Life Evaluation. Here positive emotions from the previous day such as laughter, enjoyment, learning, etc and negative emotions such as worry, sadness, anger etc are considered and evaluated.
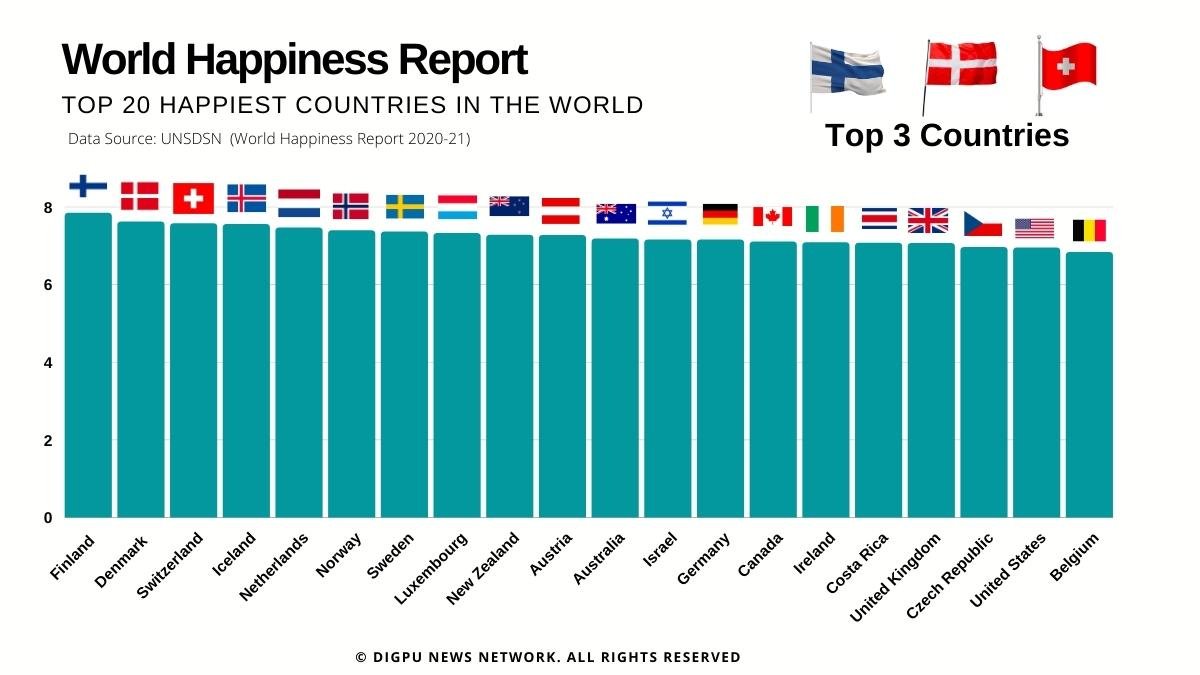
World Happiness Report -2021
Finland has been ranked the happiest country for the 4th consecutive year now. It has a happiness score of 7.842. Next to Finland in the Top 10 are – Denmark(7.62), Switzerland(7.571), Iceland(7.554), Netherlands(7.464), Norway(7.392), Sweden(7.363), Luxembourg(7.324), New Zealand(7.277), Austria(7.268)
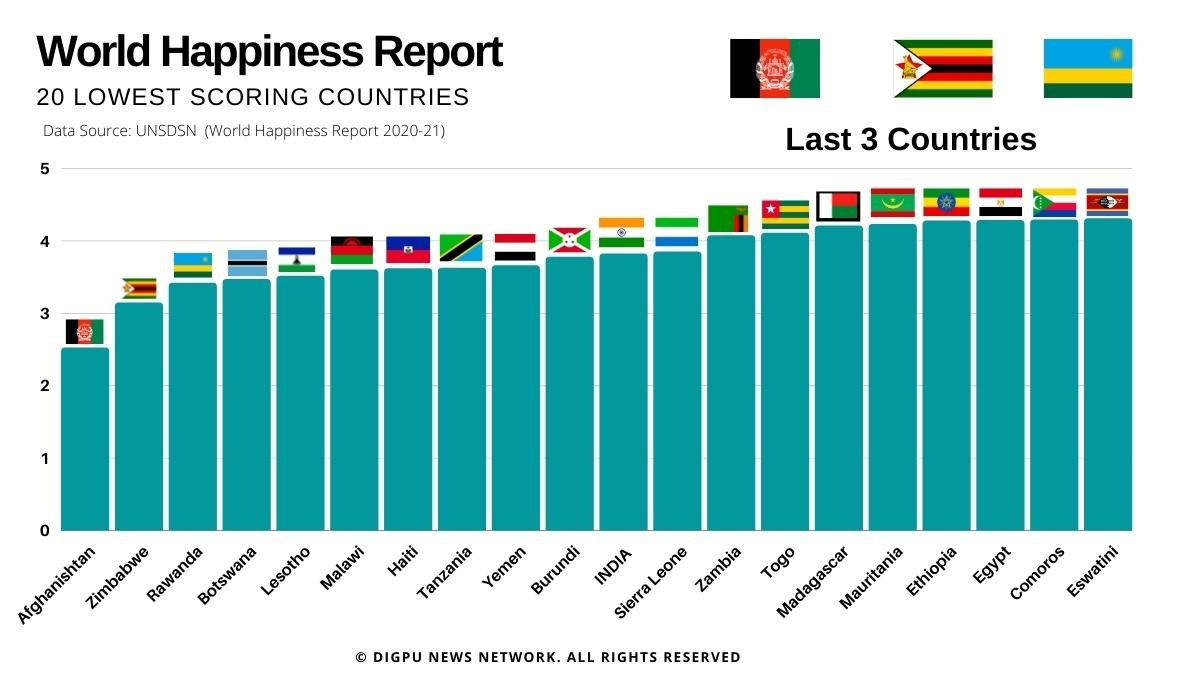
India presents a very sad picture as per the World Happiness Report 2021. India stands at 136th rank with a Happiness score of 3.819, which is higher as compared to its happiness score of 3.573 in 2020. However, the country lags behind all its neighbours like Pakistan, Nepal, Sri Lanka, China.
Pakistan stands at rank 103 with happiness, Nepal at 85, Sri Lanka at 126 and China ranks 82 in the World Happiness report. Furthermore, Taliban-run Afghanistan is the unhappiest country in the world at 146th rank. It must be noted that the opinion polls and data from Afghanistan were taken before the Taliban takeover. Afghanistan presents a disturbing picture with a happiness score of 2.523 in the year 2021 which has reduced from 2.567 in the year 2020.
Top Questions About The World Happiness Report
Q1. How is the report created? Who does the World Happiness Report?
Ans: An independent global analytics and advice firm, Gallup collects data from over 160 countries of the world. The World Happiness Report is compiled based on data collected from around the world by Gallup World Polls. The polls involve self-evaluation of general life satisfaction based on the Cantril Ladder(1) or the Cantril Self-Anchoring Scale.
Q2. What methodology is used for research by Gallup?
Ans: The Gallup world poll asks about 100 global questions and some region-specific questions to all individuals around the world. For example, people in India, Finland, Chile, Estonia and all other countries are asked the same questions and therefore data can be compared among countries in a reliable manner. This data is also used to create yearly trends and understand patterns.
All samples are randomly selected and are representational of all populations over 15 years of age in a country.
Interviews(2) are conducted in two ways – telephonic surveys and face-to-face interviews. In countries where telephone coverage is representative of around 80% of the population, Telephonic interviews are conducted using a Random-Digit-Dial(RDD) method. Usually, telephonic interviews are conducted in developed countries like the United States, Canada, Japan, Australia, Eastern Europe, etc. The interview is about half an hour long.
In developing parts of the world like the countries formerly in the Soviet Union, much of Latin America, the Middle East, Africa, most of the Asian continent, Gallup identifies randomly selected households for face-to-face interviews. This interview lasts about an hour.
In the developing world, including much of Latin America, the former Soviet Union countries, nearly all of Asia, the Middle East, and Africa, Gallup uses an area frame design for face-to-face interviewing in randomly selected households.
Q3. What is the sampling procedure of Gallup polls?
Ans: The sampling procedure includes the following basic steps:
- Selection of Primary Selection Units (PSUs): In developing countries where Gallup has to conduct face-to-face interviews, the sample selection of PSUs is done in proportion to the population. In countries where telephone interview is the usual mode of survey/interview, Gallup uses the Random-Digit-Dial(RDD) method.
- Selection Of HouseHolds: In countries where cellphone penetration is high, Gallup makes up to three attempts to reach out to a person for the interview. When an interview isn’t obtained at the originally sampled household or the person has refused to participate, they are replaced by another sampled household.
- Selection Of Respondents: In both face-to-face and telephonic interviews, respondents are selected randomly. However, equal distribution of samples based on gender is of utmost importance in some countries like the Middle East and Asian countries. Thus, all quality control measures are taken into consideration while doing the research.
Q4. Are there any exceptions to the sampling process during the collection of data?
Ans: There are few exceptions in the collection of data for sampling for the polls. This includes areas where the interviewing staff might be under threat or subject to attacks, such as war zones or other danger-infested zones. In addition to threatening situations, another exception to the collection of data can be scarcely populated far-off islands in some countries(2).
Q5. Does the sample size remain the same for all countries?
Ans. The size of the sample varies with many factors. Usually, 1000 samples per country are an average number for the polls. However, a larger number of samples are collected from large cities or those of special interest. Furthermore, in countries with a large population, a sample of at least 2000 are collected for analysis.
Q6. How often are the world polls conducted by Gallup?
Ans: World polls are conducted biannually, annually or once every two years and the duration varies from country to country.
Q7. What are the predictors of the World Happoiness Report?
Ans: The following predictors are taken into consideration while calculating the happiness of an individual:
- GDP per capita: The first predictor in the Happiness Report 2021 is the GDP per capita in terms of Purchasing Power Parity(PPP)(3) adjusted to constant with respect to 2017 international dollars. Notably, GDP data for 2021 wasn’t available during the course of the research. So, the 2020 GDP data has been extended using the country’s real-time GDP forecasts from the Organisation for Economic Co-operation and Development (OECD) Economic Outlook No. 110(4).
- Social Support: The second predictor is Social Support. It is the national average of binary responses(Yes=1, No=0) to the question “If you were in trouble, do you have any relatives or friends that you can count on for help or not?” This indicates the overall social support value for a country.
- Healthy life expectancy at birth: The third predictor is the time series for healthy life expectancy at birth. This predictor is calculated based on data from the World Health Organisation (WHO) Global Health Observatory data repository. The data acquired is from the years 2000, 2010, 2015 and 2019, which is interpolated to match the sample period 2005-2021.
- Freedom to make life choices: This predictor is the national average of binary responses (Yes=1, No=0) to the question “Are you satisfied or dissatisfied with the freedom to make decisions about your own life?“
- Generosity: This predictor is the residual of the national average responses to the question “whether the individual has made donations to any charity in the past one month” on GDP per capita data. Notably, for a middle-class family or an individual in a poor family, generosity may not be an easy choice to make. It is sometimes difficult for them to even fulfil the basic needs of life. Therefore, this predictor is not just a peek into the charity that was done the previous month. It tells more about an individual’s generosity despite their socioeconomic status.
- Perceptions Of Corruption: The perceptions of corruption are determined by obtaining answers to two questions: “Is corruption widespread throughout the government or not?” and “Is corruption impacting businesses in the country or not?“
- Positive Affect: The predictor ‘positive affect’ is defined as the average of measures of laughter, enjoyment and doing/learning something interesting from the previous day.
- Negative Affect: The predictor ‘negative affect’ is defined as the average of measures of sadness, worry and anger from the previous day.
Q8. What does ‘Happiness’ actually mean as per the World Happiness Report?
Ans: Upon reading the report, understanding all the basis of its research and methodology, we can observe that real happiness that can be assessed is not a single factor but a combination of various emotions about different aspects of life that matter to an individual. For example, the Happiness Report 2021 even includes a predictor of ‘negative affect’ to understand the essence of an individuals’ happiness.
Q9. Is there any pattern in the emotions or overall happiness in South Asia?
Ans: Here are a few striking trends in data as per the World Happiness Report:
- The interest in doing or learning something has been lowest in South East Asia, however, it is generally rising.
- Negative Affect(An average of sadness, worry and anger from the previous day) was at its highest in South Asia and MENA(Middle East and North Africa). South Asia saw the greatest increase in the values of negative affect.
- South Asia, MENA, Latin America and Sub-Saharan Africa has seen the fastest increase in sadness.
- South Asia has seen the largest increase in worry over the past 10 years.
- Anger is highly prevalent in MENA than in other parts of the world, at a fairly constant level. Surprisingly, South Asia has seen a dramatic rise in anger levels, approaching the level of MENA in this aspect.
- South Asia was the most stressed in the year 2021.
- Social Support was least in South Asia and Sub-Saharan Africa.
- All three parts of Asia (South Asia, East Asia and South-East Asia) reported alarmingly high perceived levels of corruption.
- Regional levels of well-being are on a sharp rise in South Asia.
Q10. What is the rank of India in the Happiness Index? What does India’s Happiness Report tell about the country’s condition as of today?
Ans: Here is a comparison of India’s position in the World Happiness Report as compared to its neighbouring countries:
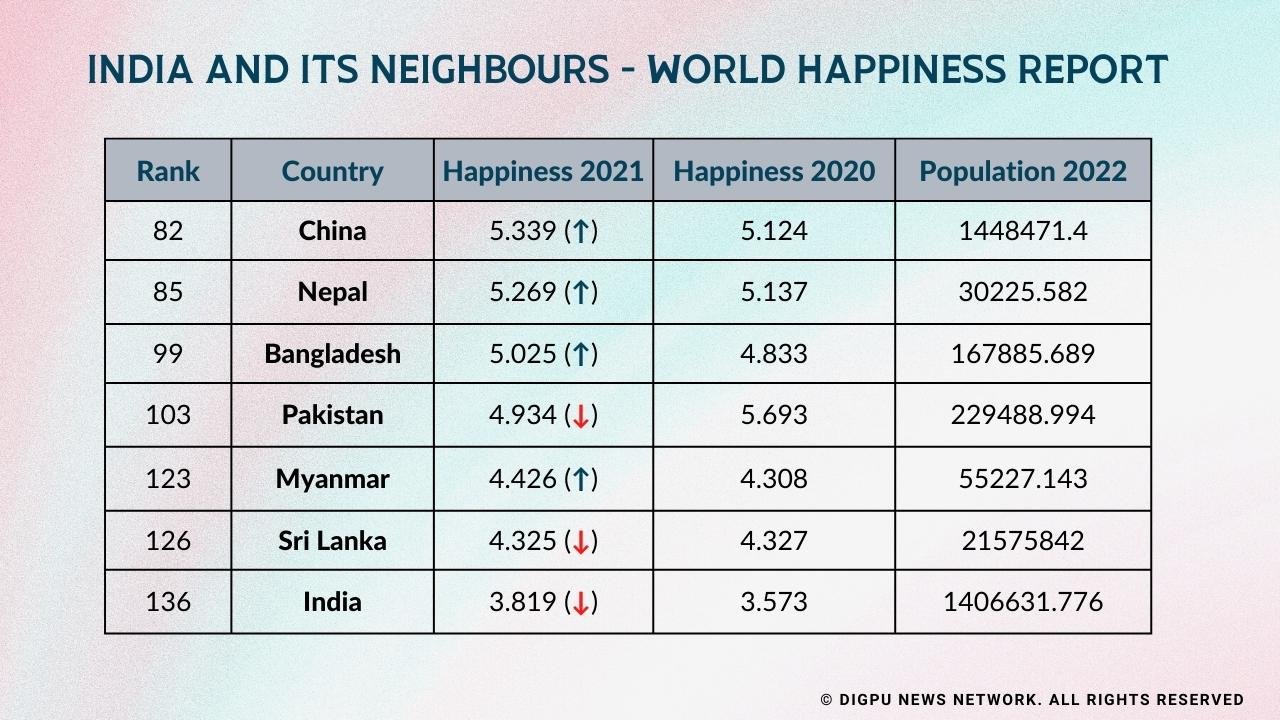
In a comparative study, India has fared worst among its neighbouring countries in the World Happiness Report. Although China and India have very high populations and have been affected adversely by the COVID-19 pandemic, China has managed to increase its happiness level in 2021 as compared to 2020. Even countries like Nepal, Bangladesh and terror-infested Pakistan has better happiness scores than India.
As discussed earlier, happiness is not just a measure of positive emotions, it is the sum of several predictors such as social security, perceived levels of corruption, healthy life expectancy in addition to the widely discussed factors like GDP, freedom to make life choices, among others. This is a very hard-hitting reality for India. Now, it is up to people who are in positions of power to act before it is too late for anybody. Citizens, media, activists and all others who can ask questions to the bureaucracy should speak truth to power.
Q, 11. Has the pandemic impacted World Happiness in any way?
Ans: During the time of the pandemic, emotions like anger, sadness, worry were high in young people, especially young men. The pandemic caused unforeseen distress to people around the world, however, it was also a source of increased trust and benevolence among people. Although Gallup hasn’t found significant changes in the measures of institutional trust during the pandemic, there have been very large increases in the frequency of acts of kindness and helping others.
Q12. Does the gender aspect have any relevance in a country’s Happiness report? Does happiness vary across genders?
Ans: Yes, happiness varies across gender. The frequency of ‘negative affect’ was generally slightly higher in female life evaluations than for males.
Citations:
- Glatzer W., Gulyas J. (2014) Cantril Self-Anchoring Striving Scale. In: Michalos A.C. (eds) Encyclopedia of Quality of Life and Well-Being Research. Springer, Dordrecht. https://doi.org/10.1007/978-94-007-0753-5_259
- METHODOLOGY How Does the Gallup World Poll Work? https://www.gallup.com/178667/gallup-world-poll-work.aspx
- Purchasing Power Parity https://en.wikipedia.org/wiki/Purchasing_power_parity
- Organisation for Economic Co-operation and Development (OECD) Economic Outlook No. 110 https://www.oecd-ilibrary.org/economics/data/oecd-economic-outlook-statistics-and-projections/oecd-economic-outlook-no-110-edition-2021-2_39740bed-en#:~:text=OECD%20Economic%20Outlook%20No.,as%20market%20forecasts%20and%20projections.
- World Happiness Report https://worldhappiness.report/ed/2022/